What’s the Earnings Yield, and Why Should You Care?
How Does Earnings Yield Help Us Understand Returns? Today and looking ahead.
Let’s cut through the jargon: the earnings yield tells you how much a company (or the whole stock market) is earning for every dollar you invest in its stock. It’s calculated as earnings per share divided by the share price-essentially the flip side of the price-to-earnings (P/E) ratio. If you’re tired of staring at P/E ratios and wondering what they mean for your wallet, earnings yield puts it in plain percentage terms. For example, an earnings yield of 5% means you’re getting 5 cents in earnings for every dollar you invest.

How Does Earnings Yield Help Us Understand Returns?
Here’s where things get interesting: the earnings yield isn’t just a number for stock nerds. It’s a quick-and-dirty way to compare what you might earn from stocks to what you could earn from “safer” investments, like U.S. Treasury bonds. When the earnings yield is high compared to bond yields, stocks look attractive. When it’s low-well, maybe you’d rather just take the steady bond payments and sleep better at night.
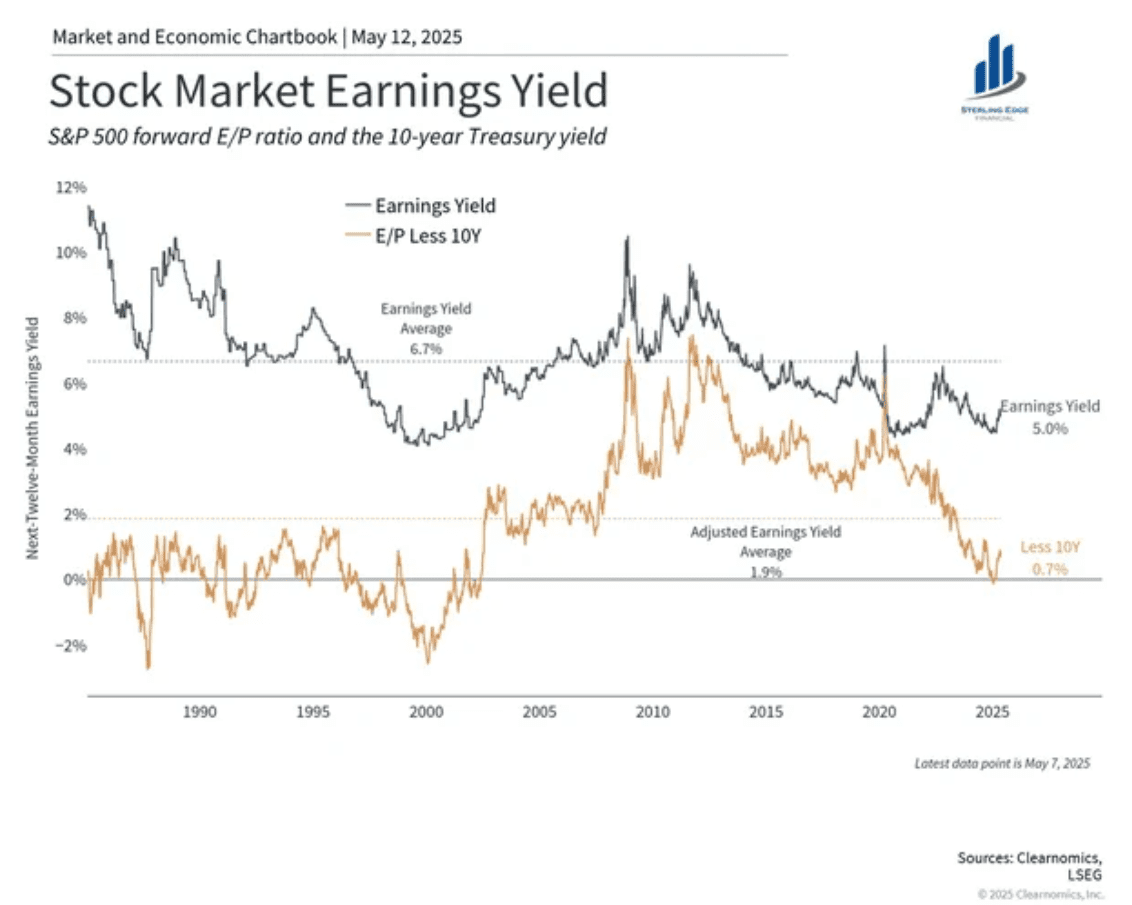
- Earnings Yield vs. Treasury Yield: The chart above shows both the S&P 500 earnings yield and the “earnings yield less the 10-year Treasury yield.” This adjusted number tells you whether stocks are offering a premium over risk-free bonds, which is a classic way to judge if the market is “cheap” or “expensive.”
Is Earnings Yield Reliable?
Earnings yield is a handy tool, but it’s not a crystal ball. Here’s what you need to know:
- Pros: It’s simple, intuitive, and lets you compare stocks to bonds in apples-to-apples terms. Historically, it’s been a decent predictor of long-term returns-over the past century, higher earnings yields have generally meant higher future returns for investors.
- Cons: It’s not perfect. Earnings can be volatile, and the metric doesn’t account for future growth, debt levels, or changes in accounting rules. In hot bull markets, earnings yields often fall as prices rise, making stocks look less attractive even if earnings are strong. And if companies are expected to grow a lot, a low earnings yield might not be a red flag.
What’s Happening in Summer 2025?
Let’s look at the chart and see what it’s telling us as we head into summer:
- Earnings Yield Has Dropped: The S&P 500 earnings yield has fallen to around 5.0%, below its long-term average of 6.7%. Why? The market’s rallied hard, pushing prices up faster than earnings.
- Adjusted for Treasuries, the Premium Is Slim: The “E/P less 10Y” (earnings yield minus 10-year Treasury yield) is just 0.7%, well below its long-term average of 1.9%. In plain English: stocks aren’t offering much more than bonds right now.
- Historical Context: Traditionally, stocks have offered a significant premium over bonds to compensate for their extra risk. When this premium shrinks, it’s a yellow flag for investors-future returns from stocks may be lower, and the risk-reward tradeoff isn’t as juicy as it used to be.
What Should Investors Take Away?
- Stocks Look Expensive Relative to Bonds: With the earnings yield premium over Treasuries at multi-decade lows, the market isn’t screaming “bargain!”
- Lower Expected Returns: Historically, when the earnings yield is low and the premium over bonds is slim, future stock returns tend to be more muted.
- Not a Time for Complacency: This doesn’t mean a crash is coming, but it does mean investors should temper expectations and perhaps review their asset allocation. If you’re counting on stocks to deliver big returns, you may want to double-check your math.
The bottom line?
Earnings yield is a powerful, no-nonsense tool to compare what you’re getting from stocks versus bonds. Right now, it’s flashing a caution sign: after a big rally, stocks are offering less of a premium over bonds than usual. That doesn’t mean you should run for the exits, but it does mean it’s time for a gut check on your portfolio and your expectations.
Curious how your own investments stack up? Want to dig deeper into what these numbers mean for you? Reach out to a financial advisor-or start a conversation with us today. Don’t let the market’s signals pass you by!

Kit Lancaster, CFP®, AWMA®
President
References:
- Earnings Yield Chart – May 12, 2025 (Clearnomics, LSEG)
- Earnings Yield Explained – Investopedia
- S&P 500 Earnings Yield – GuruFocus
- Wall Street Prep – Earnings Yield
- Earnings Yield as a Predictor – Platinum
This content is being provided for informational purposes only and should not be construed as specific recommendations or investment advice. Always consult with your investment professional before making important investment decisions. Diversification and asset allocation strategies do not assure profit or protect against loss. Indices mentioned are unmanaged and cannot be invested into directly. Past performance is no guarantee of future results. Investing involves risk. Depending on the types of investments, there may be varying degrees of risk. Investors should be prepared to bear loss, including total loss of principal.
Securities offered through Registered Representatives of Cambridge Investment Research, Inc., a broker-dealer member FINRA/SIPC. Advisory services through Cambridge Investment Research Advisors, Inc., a Registered Investment Advisor. Cambridge and Sterling Edge Financial LLC. are not affiliated.
Copyright 2025 Sterling Edge Financial
