Fixed Income Today:
Understanding Bond Yields, Risks, and Opportunities
A look at the Bond Market and Fixed Income Investing May 2025.
Ever wondered if bonds deserve a place in your investment portfolio right now? Or maybe you’re curious why your “safe” investment might not be as profitable as you thought after taxes? Let’s dive into today’s bond landscape and see where the real opportunities (and hidden pitfalls) lie for everyday investors like you.
Current Bond Yields: What You Can Earn Today
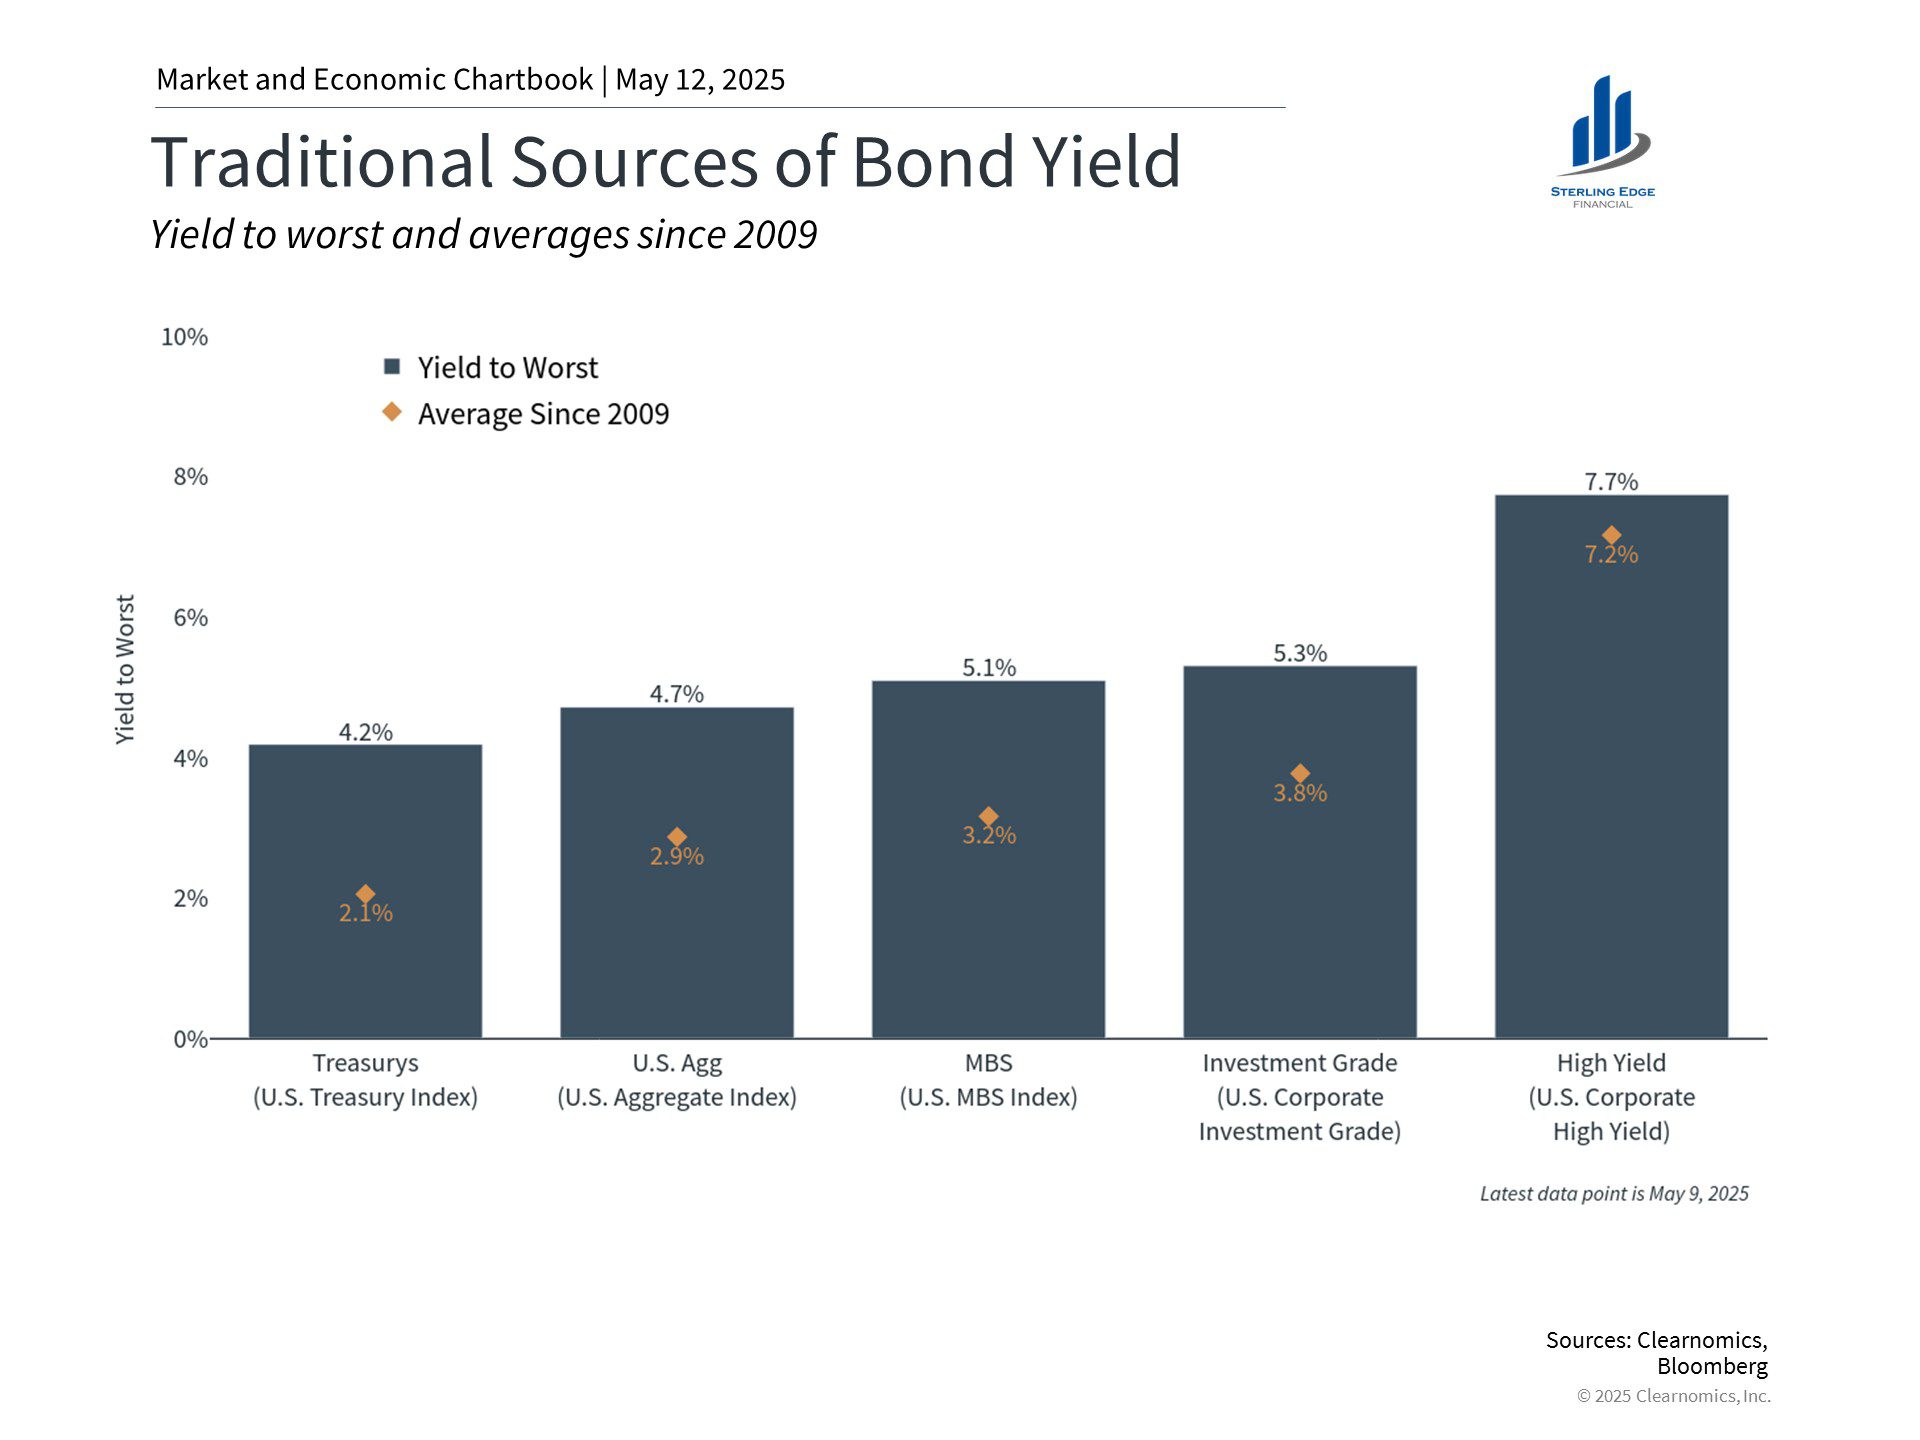
If you’re looking at fixed income investments in May 2025, here’s what you can expect to earn before taxes:
- 10-Year Treasury Bond: 4.3% (as of May 2025)
- Investment Grade Corporate Bonds: 5-6%
- High-Yield (“Junk”) Bonds: 7-9%


What’s really interesting is the spread between these different types of bonds. Looking at our first chart, you can see the earnings yield of the S&P 500 (currently at 5.0%) compared to Treasury yields. The difference between them (the orange line) is just 0.7% – well below the historical average of 1.9%. This tells us stocks aren’t offering much premium over bonds right now.
How Do These Yields Compare to Inflation?
Before getting excited about a 5% yield, let’s see what inflation is doing to your purchasing power:
-
Current Inflation (May 2025): Around 2.4%
This means your “real return” (yield minus inflation) on a 10-year Treasury is about 1.9%, while an investment-grade corporate bond might give you around 3.1%. Not terrible, but not amazing either when you consider the risks involved.
The Tax Bite: What You Actually Keep
Here’s where things get painful. Fixed income investments are notoriously tax-inefficient when held in taxable accounts.
Let’s look at what happens after taxes (assuming a 28% tax rate):
-
10-Year Treasury (4.3%): 3.1% after taxes
-
Investment Grade Corporate Bond (5.5%): 4.0% after taxes
-
High-Yield Bond (8.0%): 5.8% after taxes
After accounting for both taxes and inflation, your real after-tax return on that “safe” investment grade bond drops to just 1.6%. Ouch!

Understanding Bond Sensitivity to Interest Rates
The second chart reveals something crucial about bonds that many investors overlook: different bond sectors react differently to interest rate changes.
Notice the “modified duration” for each bond type:
-
U.S. Treasuries: 5.9 years
-
U.S. Aggregate Index: 6.1 years
-
Mortgage-Backed Securities (MBS): 5.9 years
-
Investment Grade Corporate: 6.9 years
-
High Yield Corporate: 3.5 years
What does this mean? If interest rates rise by 1%, investment grade corporate bonds would lose approximately 6.9% in value, while high yield bonds would only lose about 3.5%. The chart notes that a 1% increase in rates would result in a 5.9% decrease in Treasury prices.
This is why high yield bonds can sometimes be less risky in a rising rate environment – they have shorter durations and higher coupons that cushion against price declines.
Historical Performance: Returns and Volatility
The third and fourth charts tell a fascinating story about how different types of bonds have performed historically.
For high yield bonds:
-
They’ve delivered positive returns in most years (the dark bars)
-
2009 was an exceptional year with a 58% return following the financial crisis
-
However, they can experience significant intra-year declines (the red dots) – like the 35% drawdown in 2008
-
Recent years have shown modest positive returns with 8% in 2023 and 2% in 2024
For investment grade corporate bonds:
-
They show less volatility than high yield bonds
-
Their best year was 1995 with a 22% return
-
Maximum drawdowns are typically less severe than high yield bonds
-
Recent performance has been modest with 2% return in 2024 and 1% in early 2025
This historical context is crucial – it shows that while bonds generally deliver positive returns over time, they can experience significant temporary declines.

Understanding Default Risk: Not All Bonds Are Created Equal
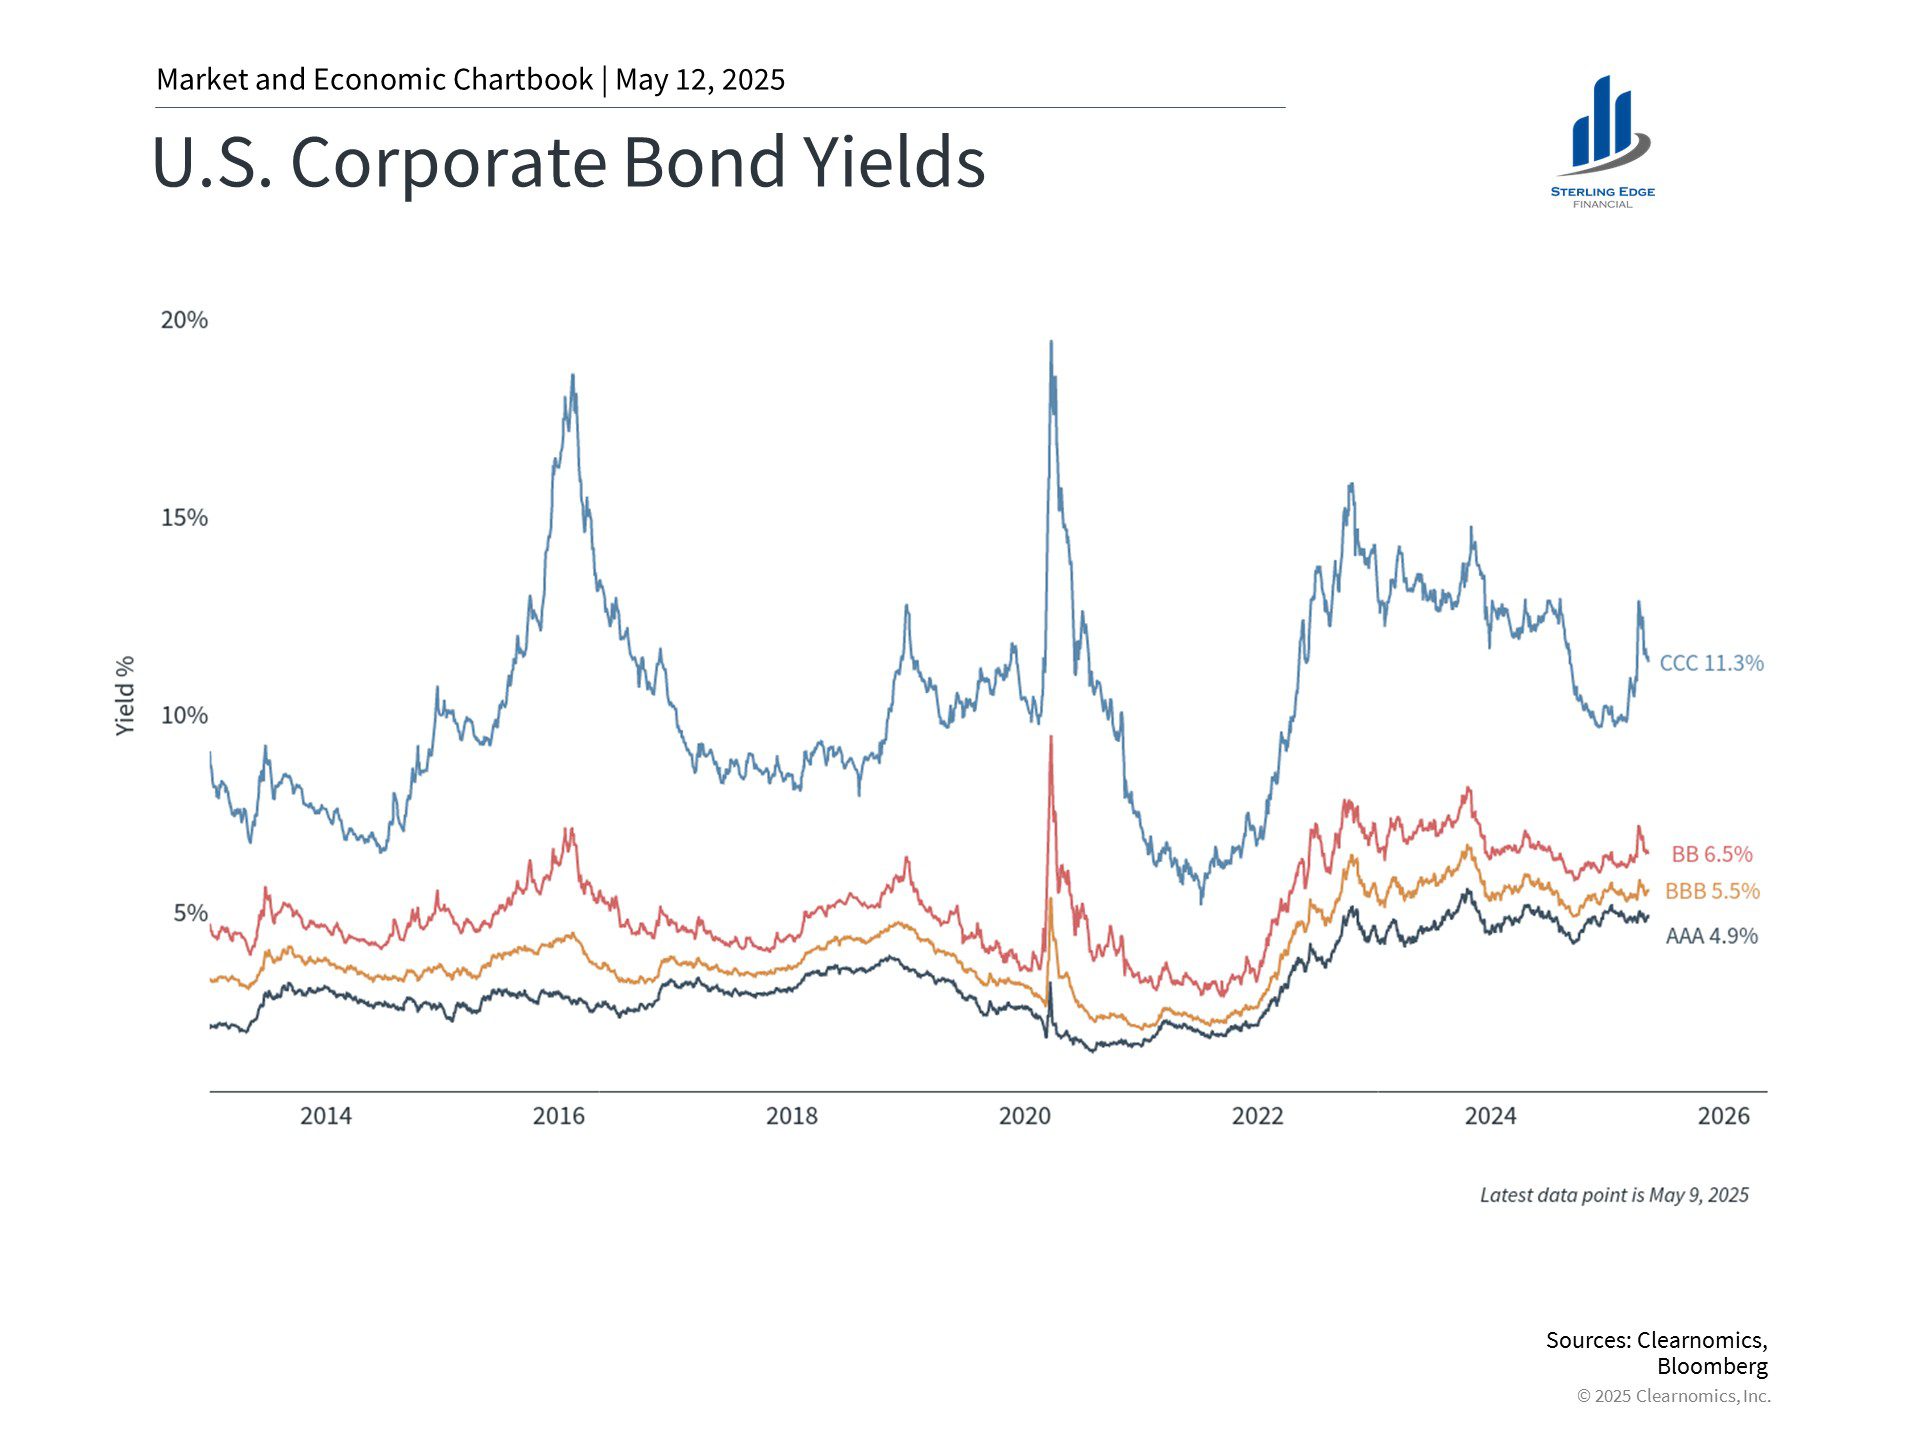
The reason some bonds pay more than others comes down to one word: risk. Let’s look at historical default rates by credit rating:
-
Investment Grade (AAA to BBB): Less than 0.5% annually
-
BB: Around 1% annually
-
B: 2-3% annually
-
CCC and below: 8-10% annually
This means if you buy 100 CCC-rated bonds, about 8-10 might default over the course of a year. That’s why they offer higher yields – you’re being compensated for taking that risk.
How Default Rates Change Year to Year
Default rates aren’t static – they fluctuate with economic conditions:
-
During recessions, default rates can spike to 10-12% for high yield bonds
-
During strong economic times, they can fall below 2%
-
Certain sectors can experience higher default rates than others
What’s particularly interesting when looking at our charts is how bond returns often recover quickly after periods of market stress. For example, after the negative returns in 2008, high yield bonds delivered a 58% return in 2009. This pattern of recovery after drawdowns appears repeatedly in the historical data.
Fixed Income for the Non-Financial Expert: Opportunities and Risks
If you’re considering bonds as part of your investment strategy, here’s what you need to know:
Opportunities:
-
Steady income: Unlike stocks, bonds provide predetermined income
-
Diversification: As shown in the charts, bonds often perform differently than stocks
-
Current attractive yields: Today’s yields are higher than they’ve been in years
-
Recovery potential: Historical patterns show bonds often recover quickly after drawdowns
Risks:
-
Interest rate risk: As our second chart shows, bonds with longer durations (like investment grade corporates at 6.9 years) are more sensitive to rate increases
-
Inflation risk: With inflation at 2.4%, you need to factor this into your real returns
-
Default risk: Especially important for high yield bonds
-
Tax inefficiency: Interest income is taxed at ordinary income rates
Tax Efficiency Matters: Where to Hold Your Bonds
Bonds generate income that’s typically taxed at your ordinary income tax rate – which can be as high as 37% federally. This makes them particularly inefficient in taxable accounts.
Consider this: If you’re in the 28% tax bracket, nearly one-third of your bond income goes to taxes. That’s why financial advisors often recommend/consider holding bonds in tax-advantaged accounts like:
-
Traditional IRAs
-
401(k)s
-
Roth IRAs (especially if you expect to be in a higher tax bracket in retirement)
For taxable accounts, makes you are getting a compelling risk after taxes and inflation. In some markets and for some investors it could make sense to consider tax-exempt municipal bonds, which provide income free from federal taxes (and potentially state taxes if you buy bonds issued in your state).
The Risk-Return Tradeoff: Higher Yield = Higher Risk
In the bond world, there’s no free lunch. Higher yields almost always come with higher risks:
-
Treasury bonds: Lowest yield, but backed by the U.S. government
-
Investment-grade corporate bonds: Moderate yields with low default risk, but higher interest rate sensitivity (6.9 years duration)
-
High-yield corporate bonds: Higher yields with higher default risk, but lower interest rate sensitivity (3.5 years duration)
The key is finding the right balance for your personal risk tolerance and financial goals.
Bottom Line: Making Bonds Work for You
Bonds can play an important role in your portfolio, but they require thoughtful placement and selection. With current 10-year Treasury yields at 4.3% and inflation at 2.4%, bonds are offering positive real returns.
However, taxes can significantly erode these returns in taxable accounts, and the various bond sectors offer different levels of interest rate sensitivity and default risk. The historical performance charts remind us that while bonds generally deliver positive returns over time, they can experience significant temporary declines.
Wondering how bonds might fit into your investment strategy? Consider how today’s bond market opportunities align with your personal financial goals and risk tolerance. The right fixed income strategy could provide the stability and income your portfolio needs.
Ready to make bonds work harder for your portfolio? Start by reviewing where you hold your fixed income investments.

Kit Lancaster, CFP®, AWMA®
President
References:
- Stock Market Earnings Yield – Clearnomics, LSEG (May 12, 2025)
- Bond Sector Interest Rate Sensitivity – Clearnomics, Bloomberg (May 12, 2025)
- High Yield Bond Total Returns and Pullbacks – Clearnomics, Bloomberg (May 12, 2025)
- Corporate Bond Total Returns and Pullbacks – Clearnomics, Bloomberg (May 12, 2025)
- 10 Year Treasury Rate – YCharts
- Default Rates by Credit Rating – Moody’s
- Tax Implications of Bond Investing – Investopedia
Fixed income investments are subject to various risks including changes in interest rates, credit quality, inflation risk, market valuations, prepayments, corporate events, tax ramifications and other factors.
This content is being provided for informational purposes only and should not be construed as specific recommendations or investment advice. Always consult with your investment professional before making important investment decisions. Diversification and asset allocation strategies do not assure profit or protect against loss. Indices mentioned are unmanaged and cannot be invested into directly. Past performance is no guarantee of future results. Investing involves risk. Depending on the types of investments, there may be varying degrees of risk. Investors should be prepared to bear loss, including total loss of principal.
Securities offered through Registered Representatives of Cambridge Investment Research, Inc., a broker-dealer member FINRA/SIPC. Advisory services through Cambridge Investment Research Advisors, Inc., a Registered Investment Advisor. Cambridge and Sterling Edge Financial LLC. are not affiliated.
Copyright 2025 Sterling Edge Financial
